


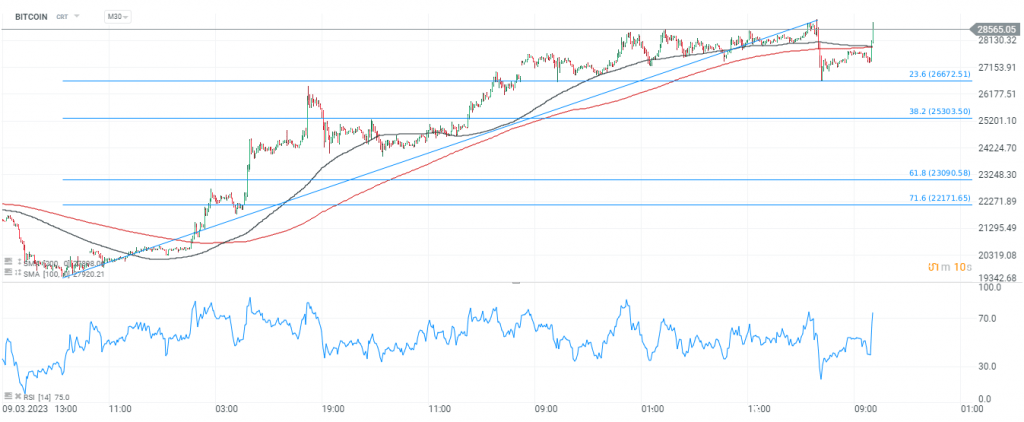
Bitcoin al alza de nuevo
La criptomoneda recupera su máximo de los últimos nueve meses.
El Bitcoin vuelve a estar en forma y recupera su mejor cotización de los últimos nueve meses. Muchos analistas dicen que se trata de un efecto refugio frente a activos tradicionales en épocas bajas.
23 de marzo de 2023
Las criptomonedas están ganando hoy junto con los principales índices de Wall Street
Los comentarios realizados por el presidente de la Fed, Powell lograron meter optimismo en el mercado y las preocupaciones sobre las crisis bancaria han disminuido.
El el ecosistema hay que resaltar que Justin Sun creador de la cripto Tron puede verse sometido a una investigación, tanto él como una serie de celebrities que participaron en la promoción de su moneda.
A su vez y Coinbase (COIN.US), recibió el llamado "Wells Notice" que evidencia la posible aplicación e irregularidades identificadas por la SEC con respecto a los activos y servicios ofrecidos en la plataforma.
La SEC sobre las criptomoneda:
La Comisión de Valores de EE. UU. (SEC) afirma que todas las criptomonedas, excepto Bitcoin, deben ser consideradas como valores. Por su parte, el intercambio Coinbase ha anunciado que se enfrentará al regulador en los tribunales por esta cuestión. En otro caso reciente, cuando Binance US adquirió los activos de Voyager en bancarrota, un juez desestimó la solicitud de la SEC para detener la transacción.
La falta de claridad en la regulación de la industria y la falta de acuerdo entre los reguladores de la SEC y la CFTC sobre la naturaleza de las criptomonedas ha sido señalada. La posición de la SEC en un caso judicial reciente fue interpretada por la industria como un posible precedente a favor de futuras victorias en casos similares contra el regulador. Sin embargo, el anuncio de la Comisión de Bolsa y Valores de EE. UU. que advertía sobre los riesgos del mercado de criptomonedas ha reducido el optimismo en el mercado.
A pesar de las declaraciones de la SEC de que las entidades que ofrecen comercio de criptomonedas podrían estar incumpliendo la ley estadounidense, las acciones del intercambio Coinbase (COIN.US) lograron recuperarse ligeramente de sus pérdidas, aunque aún cayeron alrededor de un 11%. El aumento general en la disposición al riesgo ha apoyado las cotizaciones de la criptomoneda más grande del mercado.
Bitcoin, criptomonedas en general y los bancos centrales
La legalidad de las criptomedas actuales es tema de discusión en todos los bancos centrales incluído el Banco de España, los bancos centrales no se puede decir que renieguen de este avance tecnológico que han supuesto las criptos, más bien el problema es que el ecosistema actual no es algo que ellos puedan controlar. Los bancos centrales está trabajando en sus propias monedas digitales
¿Qué son las CBDC?
Acorde a la definición del Banco de España:
Una moneda digital de banco central, o CBDC por sus siglas en inglés (Central Bank Digital Currency), es una nueva forma de dinero emitida de forma electrónica por un banco central. Los bancos centrales buscan emitir sus propias monedas digitales con el objetivo de mejorar el sistema de pagos, dado el aumento de los pagos electrónicos y el descenso del uso del efectivo, pero también porque la creación de instrumentos electrónicos de pago privados no regulados, como las stablecoins, puede poner en riesgo la estabilidad financiera.
Y si tengo Bitcoins qué uso les puedo dar:
- Pagar utilizando las criptomonedas bitcoins.
- Obtener intereses por los bitcoins que poseas: Algo similar al concepto de depósito bancario.
- Obtener un préstamo utilizando como garantía tus bitcoins.
- Cubrir tu exposición financiera con derivados en mercados regulados.
- Obtener réditos de inversión mediante la compraventa de bitcoins al ser un activo que teóricamente tiende a revalorizarse en un escenario de demanda constante.
Te recomendamos leer nuestro post sobre las 35 del IBEX

Futuros qué son y cómo funcionan
El contrato de futuros, comúnmente conocido como “futuros”
Los futuros son un producto complejo y no apto para todos los inversores.
Dentro de nuestro apartado de educación financiera te vamos a explicar qué es y en qué se basa este producto de inversión.
Futuros ¿qué son?
Atendiendo a la explicación que nos da la CNMV:
"Un futuro es un contrato por el que se acuerda el intercambio de una cantidad concreta de activo subyacente (valores, índices, productos agrícolas, materias primas…) en una fecha futura predeterminada, a un precio convenido de antemano.
Se denomina "posición larga" a la que adopta el comprador de futuros: al vencimiento del contrato tendría derecho a percibir el activo subyacente (si se liquidara por entrega física). Sin embargo, puede que el comprador prefiera cerrar su posición en el mercado antes del vencimiento realizando la operación contraria, es decir, vendiendo futuros.
La "posición corta" es la del vendedor de futuros, que se compromete a entregar el subyacente al vencimiento (si se liquidara por entrega física), a cambio del precio establecido en el contrato. Igualmente puede deshacerse tal posición comprando antes del vencimiento.
En los contratos de futuros negociados en MEFF existe una liquidación diaria de pérdidas y ganancias, esto es, MEFF calcula los beneficios o pérdidas para la posición del cliente, resultado de comparar el precio fijado en el contrato (denominado precio de ejercicio), con el precio de mercado del subyacente del contrato, y abona o carga en la cuenta del cliente."
Características de los futuros:
- Los futuros son productos financieros derivados.
- Como productos derivados, su cotización varía en función del activo subyacente.
- Las condiciones de los contratos están estandarizadasen lo que se refiere a importe nominal, objeto y fecha de vencimiento.
- Son negociados en mercados organizados y controlados, con lo que se pueden vender y comprar sin esperar a la fecha de vencimiento.
- Tanto para comprar como para vender futuros, los intervinientes deben aportar garantías al mercado, es decir, una cantidad de dinero en función de las posiciones abiertas para evitar el riesgo de contrapartida mencionado anteriormente.
- Es un producto que se puede vender sin necesidad de haber comprado anteriormente, esto es lo que en el mercado se conoce como posiciones cortas.
Tipos de operaciones con Futuros
Lo primero que debemos comentar es que hay diferentes tipos de futuros, nos vamos a concentrar en los 3 más importantes
- Operaciones de cobertura: operaciones que consisten en la compra o venta de contratos de futuros que tengan como subyacente un activo que tenemos en cartera para reducir o eliminar el riesgo de fluctuación de precios de dicho activo.
- Operaciones especulativas: Son aquellas en las que se compran o se venden futuros con vistas a obtener una plusvalía a corto plazo, independientemente del activo en el que estemos invirtiendo.
- Operaciones de Arbitraje: El arbitraje se produce cuando un valor se negocia en varios mercados y, por circunstancias locales, se produce una diferencia de precios que aprovechamos para comprar donde cotiza más barato y vender donde cotiza más caro.
Precaución a tener en cuenta sobre los futuros:
Los futuros son productos apalancados y, como tales, tienen efectos multiplicadores tanto en las pérdidas como en las ganancias. Las pérdidas pueden ser mucho mayores que las garantías que depositó para la apertura de la posición
Hemos encontrado este vídeo en el canal de Bolsa para principiantes que esperamos te resulte interesante:
Noticias bursátiles de la mañana
Resumen de las principales noticias del cierre americano y apertura europea
Mercado americano cierre de ayer 22/03/2022
El SP500, el Nasdaq y el Dow Jones se alejan de máximos intradía
Las palabras de Yellen suponen un jarro de agua fría para el mercado, tal y como se esperaba la Fed elevó las tasas en 25 pb a 4.75%-5% y el SP500, el Nasdaq y el Dow Jones se alejan de máximos intradía
La Reserva Federal (Fed) ha aumentado las tasas en 25 puntos básicos a un rango objetivo del 4.75% al 5%, tal como se esperaba, con el fin de abordar la alta inflación. Además, la Fed ha destacado una mayor incertidumbre en relación con posibles aumentos futuros de las tasas, en medio de una crisis bancaria. A pesar de ello, el sistema bancario de EE. UU. se mantiene sólido y resistente.
Sin embargo, es posible que esta medida dé lugar a condiciones crediticias más estrictas para hogares y empresas, lo que podría tener un efecto negativo sobre la actividad económica, la contratación y la inflación. Aunque el alcance exacto de estos efectos es incierto, el Comité de la Fed se mantiene alerta frente a los riesgos inflacionarios.
Después de la reunión de la Fed, las bolsas estadounidenses iniciaron una tendencia alcista, con el Dow Jones subiendo más de 140 puntos, el S&P 500 más de 30 puntos y el Nasdaq 100 avanzando más de 180 puntos. Sin embargo, tras las declaraciones de Yellen, las bolsas cayeron con fuerza desde los máximos de la sesión.
La Fed elevó los tipos de interés de los fondos federales en 25 puntos básicos, hasta el 4,75%-5%, lo que se esperaba. El Russell 2000 cotizaba plano después de la subida de tasas.
Durante la rueda de prensa, el presidente de la Fed, Powell, indicó que se habían considerado opciones como una pausa antes de la reunión, pero que la inflación sigue siendo elevada y la Fed mantiene su compromiso de reducirla al 2%.
Powell también mencionó que aún no se observan avances significativos en la inflación subyacente de los servicios, excluyendo la vivienda, aunque los datos de inflación sugieren una inflación más fuerte. Además, señaló que el alcance del impacto de las condiciones crediticias más estrictas es incierto y abogó por estar alerta ante nuevas alzas de tasas.
Hoy, en la Eurozona publicarán el dato preliminar de marzo de la confianza del consumidor (-18,2e vs -19.0 anterior). En EE.UU. se publicarán las peticiones iniciales de desempleo semanal (198.000e vs 192.000 anterior). Por último, en Reino Unido harán publica la tasa de interés de referencia del Banco de Inglaterra (4,25%e vs 4,00% anterior).
Referencias para la elaboración de este resumen:

Resumen de la mañana
Hechos relevantes en el mundo de la inversión hoy 23/03/2023
Desde XTB nos resumen los que pueden ser los puntos más importantes del día en el mundo de la inversión:
- A la baja los principales índices americanos, el S&P 500 cayó un 1,65 % a la par que el Dow Jones bajó un 1,63 % y el Nasdaq se desplomaba un 1,60 %. Russell 2000 terminó 2.83% más bajo
- En Asia-Pacífico los índices cotizaron de manera dispar el Nikkei cayó un 0,17 %, el S&P/ASX 200 bajó un 0,67 %, mientras que el Kospi y el Nifty 50 subieron un 0,30 % y un 0,06 % respectivamente
- En China el índice cerró 0.39-0.69% más altos
- Los futuros del DAX alemán apuntan a una apertura al alza de la sesión de hoy
- El presidente de la Fed, Jerome Powell: no ven recortes de tipos este año y que están preparados para subir los tipos más de lo esperado si es necesario.
- La secretaria del Tesoro, Janet Yellen, dijo que el gobierno de EE. UU. no estaba considerando un "seguro general" para los depósitos bancarios
- BoA redujo su previsión de fondos federales terminales a 5 - 5,25 % desde el 5,25 - 5,5 % anterior
- Goldman Sachs espera que el oro alcance la marca de 2.050$ en 12 meses
- Moody's advierte que un largo período de restricciones financieras corre el riesgo de que el estrés se extienda más allá de la banca
- La unidad Evergrande de China advierte que puede detener la producción debido a la falta de fondos
- El economista jefe del RBNZ, Conway, dijo que si las expectativas de inflación no caen, es posible que los formuladores de políticas tengan que hacer más.
- Coinbase recibió un aviso de los reguladores de EE. UU. sobre la acción de cumplimiento debido a supuestas violaciones
- Las criptomonedas cotizan al alza hoy: Bitcoin gana un 1,9 %, Ethereum suma un 1,4 %
- Se pueden observar estados de ánimo mixtos en el mercado de materias primas energéticas: el petróleo cae más del 0,7 % mientras que los precios del gas natural en EE. UU. aumentan más del 2,3 %
- Los metales preciosos subieron: la plata subió un 0,5 %, el oro subió un 0,75 %
- AUD y NZD son las monedas principales con mejor rendimiento, mientras que USD y CHF son las que más se rezagan.
Información recogida de XTB
xStation
xStation es un moderna plataforma desarrollada por XTB de trading online que permite operar traders tanto principiantes como experimentados.
Características particulares:
-Ejecución con un click, directamente desde el gráfico
-Herramientas de análisis técnico avanzadas
-Representación gráfica de tus inversiones en grupos
-Diseño completamente personalizable para amoldarlo a tu trading
-Calculadora de trading avanzada, para una total transparencia
-APi abierto, que puede ser útil para crear aplicaciones propias, scripts y sistemas de trading – además puedes descargarlas de la xStore.
-Accesible desde cualquier dispositivo móvil, como smartphones, tablets y cualquier ordenador o portátil.
Con XTB podrás operar con 5.600 instrumentos accede y regístrate
Las 35 del IBEX
Listado de empresas que forman el Ibex 35 y su cotización
Ya hemos explicado en un post anterior la historia del IBEX 35 sólo a modo de repaso comentar el origen en sí de la palabra IBEX y el número 35
IBEX 35 historia
La palabra IBEX corresponde acrónimo de las palabras “Iberia Index”, o índice ibérico en su traducción al español. Y lleva el sufijo 35 porque agrupa a las 35 mayores empresas de nuestro país en términos de liquidez y su valor se calcula de forma ponderada
El número de empresas que forman el índice de referencia son 35 pero a lo largo de la historia han sido 60 empresas las que han formado parte del mismo, tras enumerar las que forman parte actualmente listaremos las 25 que ya no lo hacen.
Empresas del IBEX 35
De cara a evaluar las empresas que se mantienen en el IBEX dada año se celebran dos reuniones ordinarias del Comité Asesor del Ibex, una en junio y otra en diciembre. Además, en marzo y en septiembre el comité realiza dos reuniones de seguimiento.
De cara a seleccionar las empresas del Ibex se tiene en cuenta el volumen de contratación durante el periodo de control. Además, para entrar en el Ibex 35 las empresas tienen que cumplir un mínimo de capitalización
IBEX 35
Historia del IBEX 35 - 30 años de recorrido
¿Te has preguntado por el origen del IBEX 35 y qué significa en sí la palabra IBEX?
Te lo vamos a contar en este post
La palabra IBEX corresponde acrónimo de las palabras “Iberia Index”, o índice ibérico en su traducción al español. Y lleva el sufijo 35 porque agrupa a las 35 mayores empresas de nuestro país en términos de liquidez y su valor se calcula de forma ponderada.
Origen de los índices bursátiles como referencia
El origen de los índices bursátiles se atribuye al periodista estadounidense Charles Henry Dow, fundador del The Wall Street Journal, que el 3 de julio de 1884, al observar que la mayoría de las cotizaciones bajaban o subían de manera similar, decidió expresar esta tendencia con una selección de las compañías más representativas del mercado, a la que se denominó Dow Jones Transportation Average.
Historia y evolución del IBEX 35
El IBEX es un índice relativamente moderno, nace en el año 1992 como el índice de referencia para el mercado de opciones y futuros que también nacía ese año.
En estos 31 años la economía española se ha multiplicado por 3 en términos de PIB mientras que el índice, con sus vaivenes, se ha multiplicado por 10 así que podríamos decir a priori que ha sido una muy buena inversión para aquellos que invirtieran en el inicio del mismo.
Son 35 las compañías a las que hace referencia el índice pero a lo largo de estos años han sido 60 las compañías que han formado parte del mismo.
Los primeros de los 10 años del índice se puede decir que fueron años dorados, la Bolsa española experimentó un fuerte impulso y modernización impulsadas por la Reforma del Mercado de Valores, la extensión del sistema electrónico de negociación de los mercados y en última instancia la entrada de España en la primera fase de la Unión Monetaria Europea. Las privatizaciones de las principales empresas participadas por Estado contribuyó a que particulares se lanzaran a invertir en la Bolsa, un efecto que se denominó "capitalismo popular"
Tras los años dorados llegaron los malos, el pinchazo de las “puntocom” puso fin a un intenso proceso de OPVs, privatizaciones y salidas a Bolsa de gran número de empresas privadas.
Llegamos al año 2002 y al arranque del Euro y comienza una época de expansión económica que tuvo un efecto positivo en la Bolsa que era un vehículo a través del cual se financiaban las grandes compañías. Se multiplicaron el número de productos e índices con el desarrollo de warrants, ETFs o futuros y opciones sobre nuevas acciones.
El año 2006 es otro año importante para la Bolsa, nace el BME Growth
Tras periodos de buenas noticias siempre acaban llegando las malas, llegamos al año 2008 y llega el misil Lehman Brothers a la línea de flotación de la economía mundial. Este hecho supuso punto álgido de una larga crisis financiera mundial, "la Gran Recesión". Posterior a esta crisis vino la de la deuda soberana en el euro que provocó grandes cambios en el sistema financiero y correcciones en algunos desequilibrios estructurales de la economía española, como su excesiva dependencia del crédito bancario.
La irrupción del Covid en marzo de 2020 representó una nueva prueba y reafirmó la función de los mercados como proveedores de financiación y fluidez para encarar la recuperación y el progreso, en un entorno novedoso caracterizado por la sostenibilidad y la digitalización.
Cotización y evolución histórica del IBEX 35
Cotización del Ibex 35 en tiempo real
Evolución histórica del Ibex 35

Si buscas un broker con el que operar la compra y ventas de productos de inversión como acciones, CFDs, ETFs entra en nuestro comparador de brokers
Enlaces de interés del contenido aquí expuesto:
Toda la actualidad del BME:

Advertencia CNMV
ADVERTENCIA DE ENTIDADES NO REGISTRADAS EN SUPERVISORES INTERNACIONALES
En la CNMV han publicado la siguiente advertencia, como todas las que publican es bueno conocerlas y tenerlas en cuenta a la hora de elegir una plataforma de trading para evitar problemas futuros.
Advertencia:
Madrid, 22 de marzo de 2023
La Comisión Nacional del Mercado de Valores (CNMV) hace públicas las advertencias recibidas a través de los supervisores internacionales sobre las entidades no registradas que se adjuntan en el siguiente listado:
| Entidad advertida | Regulador | Observaciones |
| DIAMOND CRYPTO FINANCE diamondcryptofinance.com | FCA - REINO UNIDO | |
| GLOBALCRYPTOTRADEALLIANCE GLOBAL CRYPTO TRADE ALLIANCE globalcryptotradealliance.com/ | FCA - REINO UNIDO | |
| MAIN CRYPTO TRADES ZEDEX TRADE maincryptotrades.com/ | FCA - REINO UNIDO | |
| OCTAFX-EARN octafx-earns.com | FCA - REINO UNIDO | |
| BITFXD bitfxd.com | FCA - REINO UNIDO | |
| WEALTH FUND MANAGEMENT INTERNATIONAL wealthfundmanagement.com | FCA - REINO UNIDO | |
| EXCELLENCE TRUST BANK excellencetrustbanking.com | FCA - REINO UNIDO | |
| PERFECTIS LOANS perfectis-loan.com | FCA - REINO UNIDO | |
| PREMIUM CRYPTO GAIN premiumcryptogain.ltd | FCA - REINO UNIDO | |
| KNOWNFX knownfx.com/ | FCA - REINO UNIDO | |
| WINTRADE X wintradex.com/ | FCA - REINO UNIDO | |
| DAZON-CAPITAL / COINTRADEX DAMON-CAPITAL dazon-capital.com/ | FCA - REINO UNIDO | |
| FIRM EXCHANGE firm-exchange.site | FCA - REINO UNIDO | |
| DIGITALTRADE digitalfxtrade.live | FCA - REINO UNIDO | |
| CRYPTOMETATRADES cryptometatrades.com | FCA - REINO UNIDO | |
| BITMINEFX HUB bitminefxhub.com | FCA - REINO UNIDO | |
| STOCKHUTFX INC stockhutfxinc.com | FCA - REINO UNIDO | |
| CROMVOX cromvox.net | FCA - REINO UNIDO | |
| GEMSTRADE ASSETS gemstradeassets.com | FCA - REINO UNIDO |
| INFINITEOPTIONTRADE infiniteoptiontrade.org | FCA - REINO UNIDO | |
| LION BONDS HTTP://LION-BONDS.COM/ | CBI - IRLANDA | |
| CREST-CREDITS.XYZ crest-credits.xyz | FCA - REINO UNIDO | |
| EAGLEMARKETSPRO.ONLINE eaglemarketspro.online | FCA - REINO UNIDO | |
| ITG INVESTING itginvesting.com | FCA - REINO UNIDO | |
| AUTO STOCK TRADING autostocktrade.online | FCA - REINO UNIDO | |
| PROMINERS FXT prominersfxt.com | FCA - REINO UNIDO | |
| META FX / META FOREX MARKETS LTD metafx.ai | FCA - REINO UNIDO | |
| FUSION24FX fusion24fx.com | FCA - REINO UNIDO | |
| FAIRFIELD CAPITAL PARTNERS LLC fairfieldcapitalpartnersllc.com | FCA - REINO UNIDO | |
| MERCADOS DE VALORES mercadosdevalores.com | FCA - REINO UNIDO | |
| FIRSTCRYPTOINVESTMENT FIRST CRYPTO INVESTMENT firstcryptoinvestment.com | FCA - REINO UNIDO | |
| HUGOWAYOPTIONS HUGO WAY OPTIONS HW OPTIONS hugowayoptions.com | FCA - REINO UNIDO | |
| SWISS FX INVESTMENTS swissfx.co.uk | FCA - REINO UNIDO | |
| GRAND CAPITAL LTD grandcapital.net | HCMC - GRECIA | |
| CITIBANK EUROPE PLC (CLONE) | CBI - IRLANDA | La entidad advertida usa de manera fraudulenta los datos de la entidad legítimamente registrada del mismo nombre CITIBANK EUROPE PLC |
| SE FINANCE sef-global.com/ | CSSF - LUXEMBURGO | |
| I-GLOBAL MANAGEMENT VAQUITA FUND | CSSF - LUXEMBURGO | |
| FLACK CONSULTING LLC arkcoin.live webtrader.aktrade.cc | CONSOB - ITALIA | LA CONSOB ORDENA A LOS OPERADORES DE INTERNET EL BLOQUEO DE ACCESO DESDE ITALIA A PAGINAS WEB QUE OFRECEN SERVICIOS DE INVERSION SIN ESTAR AUTORIZADAS |
| SHLACK CONSULTING LLC tradegenics.co | CONSOB - ITALIA | LA CONSOB ORDENA A LOS OPERADORES DE INTERNET EL BLOQUEO DE ACCESO DESDE ITALIA A PAGINAS WEB QUE OFRECEN SERVICIOS DE INVERSION SIN ESTAR AUTORIZADAS |
| FLORISHING GROUP LLC bstrade.world webtrader.bstrade.top | CONSOB - ITALIA | LA CONSOB ORDENA A LOS OPERADORES DE INTERNET EL BLOQUEO DE ACCESO DESDE ITALIA A PAGINAS WEB QUE OFRECEN SERVICIOS DE INVERSION SIN ESTAR AUTORIZADAS |
| BROKER CAPITALS LTD brokercapcfd24.com platform2.brokercapcfd24.com | CONSOB - ITALIA | LA CONSOB ORDENA A LOS OPERADORES DE INTERNET EL BLOQUEO DE ACCESO DESDE ITALIA A PAGINAS WEB QUE OFRECEN SERVICIOS DE INVERSION SIN ESTAR AUTORIZADAS |
| VIRTUFINANCE virtufinance.come webtrader.virtufinance.com | CONSOB - ITALIA | LA CONSOB ORDENA A LOS OPERADORES DE INTERNET EL BLOQUEO DE ACCESO DESDE ITALIA A PAGINAS WEB QUE OFRECEN SERVICIOS DE INVERSION SIN ESTAR AUTORIZADAS |
| GOLDINGFX goldingfx.net | HCMC - GRECIA | |
| solidstocks.co | HCMC - GRECIA | |
| VARIOS GRECIA | HCMC - GRECIA | LA HCMC ADVIERTE DEL CASOS DE PLATAFORMAS DE NEGOCIACIÓN ONLINE O SITIOS WEB DONDE SE PROPORCIONA INFORMACIÓN ENGAÑOSA (COMO NOMBRE, DOMICILIO SOCIAL, ETC.) QUE SON IDÉNTICOS O SIMILARES A LA INFORMACIÓN DE LAS ENTIDADES DEBIDAMENTE REGISTRADAS. |
| allcryptcapital.com (clone) | HCMC - GRECIA | EL DOMINIO QUE APARECE EN LA ADVERTENCIA NO GUARDA RELACIÓN CON LA ENTIDAD DE NOMBRE CAPITAL SECURITIES AEPEY |
| TITANCFD.COM (CLONE) CRYPHEINE.COM (CLONE) CRYPFREX.COM (CLONE) CRYPGIRAN.COM(CLONE) AXICAPITALS.COM (CLONE) BITHEET.COM (CLONE) CRYPBARRY.COM (CLONE) BITWAYNE.COM (CLONE) AXICAPITALCFD.COM (CLONE) BITBARY.COM (CLONE) CRYPTOBARY.COM (CLONE) MAKE-CRYPTO.COM (CLONE) BITOPEER.COM (CLONE) CRYPRUNA.COM (CLONE) COINRACE.COM (CLONE) BITDEXIO.COM (CLONE) TAUMPUN.COM (CLONE) CRYPATLANT.COM (CLONE) BITBARRY.COM (CLONE) BITATLANT.COM (CLONE) BITOFIA.COM (CLONE) CRYPTOHOX.COM (CLONE) BTCAMIX.COM (CLONE) MAKE-CRYPTO.COM (CLONE) CRYPHOX.COM (CLONE) CRYPADEN.COM (CLONE) BTCANYX.COM (CLONE) EXCHANGE-PRO.ONLINE.COM (CLONE) BITEVAIO.COM (CLONE) CRYPSNEX.COM (CLONE) BTCATIX.COM (CLONE) BITPARET.COM (CLONE) BITMIRC.COM (CLONE) BITWUX.COM (CLONE) NAERAX.COM (CLONE) CRYPTOYOS.COM (CLONE) TRADECLAY.COM (CLONE) MONDIALFX.COM (CLONE) UP-BIT.COM (CLONE) TITAN-CFD.COM (CLONE) | HCMC - GRECIA | LOS DOMINIOS QUE APARECEN EN EL LISTADO NO GUARDAN RELACION CON LA ENTIDAD DE NOMBRE VIE FINANCE AEPEY. |
Las advertencias de reguladores extranjeros de ámbito europeo pueden ser consultadas en la web de la CNMV como advertencias sobre entidades no autorizadas y como otro tipo de advertencias.
Además, la web de la CNMV ofrece un buscador de entidades advertidas.
Se pueden consultar más advertencias de reguladores no europeos en la web de IOSCO a través del enlace Investor Alerts.
Consulta nuestro post sobre otras advertencias sobre CNMV

Análisis Ibex 35
El Ibex 35 cotiza al borde de los 9000 puntos a la espera de la Reserva Federal
Resumen del análisis realizado por Diego Amorín
El sector bancario impulsó una recuperación en los mercados bursátiles ayer martes, tras las medidas tomadas por los bancos centrales para estabilizar el sector después de los días turbulentos recientes. Sin embargo, es importante mantener la cautela debido a la persistente presión sobre los bancos regionales en Estados Unidos.
Hoy, la atención se centra nuevamente en la Reserva Federal (Fed) y las declaraciones de Jerome Powell, lo que podría agregar volatilidad al mercado después de unos días tumultuosos por los problemas de Silicon Valley Bank (SVB) y otros bancos que aún cotizan con nerviosismo. El mercado está a la espera del "tono" de Powell y de las intenciones de los miembros del FOMC para los próximos meses.
Hoy por la mañana, se publicó el IPC de Reino Unido, que ha vuelto a registrar un aumento en el doble dígito, alcanzando un +10,4% interanual. Este dato evidencia los problemas que existen en cuanto a la inflación en el país, y envía un mensaje claro al Banco de Inglaterra (BoE) en caso de que decida reducir el ritmo de subida de los tipos de interés.
La bolsa española, representada por el Ibex 35, registró un aumento del 2,45% y superó los 9000 puntos gracias a la recuperación del sector bancario. Hoy en día, el Ibex 35 se enfrenta al desafío de mantener este nivel ante la reunión de la Reserva Federal de EE.UU. Sin embargo, si el índice logra alcanzar los 9190 puntos, podría anular la corrección de los últimos días. De lo contrario, podríamos ver más retrocesos hacia los 8800 puntos.
Datos macroeconómicos de relevancia que se publican hoy
· 09:45 horas -> Comparecencia de Lagarde, presidenta del BCE
· 15:30 horas -> Inventarios de petróleo crudo de la AIE
· 19:00 horas -> Proyecciones económicas del FOMC
· 19:30 horas -> Rueda de prensa de Jerome Powell
Para leer el análisis completo accede aquí
Accede a nuestro comparador de brokers
Renta 4 análisis
Se espera que la Fed +25pbs y discurso sensible con la inestabilidad financiera
Renta 4 nos manda este análisis con los principales hechos financieros del día de hoy:
Principales citas macroeconómicas
En Estados Unidos se celebrará la reunión de la Fed
Hoy, en Reino Unido publicarán el dato de IPC anual (+9,9%e vs +10,1% anterior) y subyacente (+5,7%e vs +5,8% anterior). En EE. UU., reunión de la Fed (Ver Mercados En Esta Sesión).
Mercados financieros
La Reserva Federal (Fed) se reunirá hoy en un contexto de inestabilidad y dudas en torno al sector financiero. Aunque ha habido cierta tranquilidad en los últimos días con el apoyo de los reguladores, quienes han establecido redes de seguridad para el sector financiero, se espera que la Fed decida sobre una subida de +25pb, lo que situaría los tipos en 4,75%-5%. Esta decisión ha elevado la probabilidad de subida al 90%, sin expectativas de subidas adicionales en siguientes reuniones. Antes de la inestabilidad financiera, se estimaba un techo de tipos en 5,5%-5,75%.
Sin embargo, dudamos de que la Fed tome un giro inminente en su política monetaria, y es posible que el presidente de la Fed, Powell, enfrié las expectativas de una bajada de 75 pb para finales de año, ya que la inflación (general 6% y subyacente 5,5%) sigue muy por encima del objetivo del 2%. Hoy, la Fed presentará su cuadro macro actualizado y su nuevo dot plot, el cual en diciembre de 2022 apuntaba a un techo de tipos del 5,1% a finales de 2023. Además, se debe tener en cuenta que la actual crisis bancaria podría tensionar la política monetaria, ya que las estimaciones sugieren que el endurecimiento crediticio derivado de la crisis podría tener un impacto equivalente a +150 pb.
En cualquier caso, es importante destacar que esperamos que el mensaje de la Fed sea sensible y tome en cuenta uno de sus objetivos, que es la estabilidad financiera, además de la estabilidad de precios y el pleno empleo. Es importante tener en cuenta que el contexto de la banca regional americana sigue generando temores, y esto se ha visto agravado por el reciente endurecimiento de las condiciones crediticias. Por lo tanto, esperamos que la Fed tenga en cuenta estos factores al tomar su decisión y al comunicar su mensaje al público.
En relación a lo que mencionas sobre Yellen y su apoyo a los depósitos de los pequeños bancos en caso de ser necesario para frenar la inestabilidad en el sector financiero americano, es importante tener en cuenta que estas medidas pueden contribuir a estabilizar la situación. Sin embargo, aún se sigue buscando una solución para el First Republic Bank, que después de haber subido un 29% en la sesión regular de ayer, ha sufrido una caída de cerca del 20% en los mercados fuera de hora. Esta situación resalta la necesidad de seguir trabajando en la estabilidad financiera y tomando medidas adecuadas para abordar los desafíos actuales del sector financiero.
Hoy, el enfoque macroeconómico se centra en el Reino Unido, con el índice de precios al consumidor (IPC) de febrero. Se espera una moderación adicional tanto en la tasa general de inflación (+9,9%e vs +10,1% anterior) como en la subyacente (+5,7%e vs +5,8% anterior), aunque ambas siguen estando muy lejos del objetivo del 2%. Esto ha dejado al mercado dividido en un 50% sobre si el Banco de Inglaterra subirá los tipos de interés en su reunión de mañana en 25 puntos básicos o si los mantendrá sin cambios. En cualquier caso, el mercado solo descuenta una subida adicional de 25 puntos básicos, lo que situaría los tipos en un nivel del 4,25% y se mantendrían en este nivel para el resto del año.
No dejes de visitar la sección de análisis de Renta 4 para mayor información
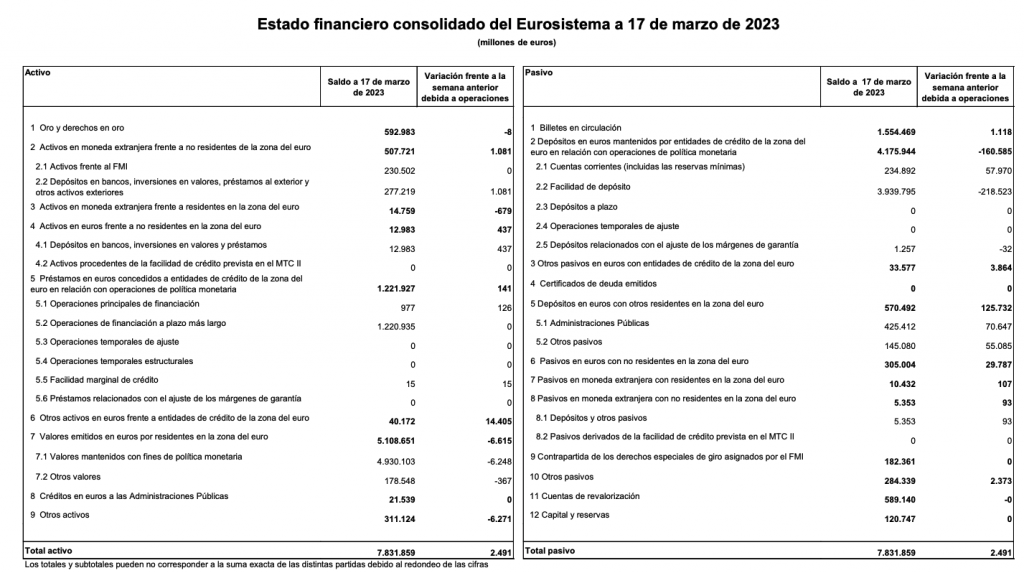
BCE Estado financiero consolidado del Eurosistema a 17 de marzo de 2023
En la semana que finalizó el 17 de marzo de 2023, la posición neta del Eurosistema en moneda extranjera se incrementó en 0,2 mm de euros y se situó en 324,3 mm de euros
Comunicado del BCE sobre moneda extranjera.
El BCE informa que en la semana que finalizó el 17 de marzo de 2023, la posición neta del Eurosistema en moneda extranjera (diferencia entre, por un lado, la suma de las partidas 2 y 3 del activo y, por otro, la suma de las partidas 7, 8 y 9 del pasivo) se incrementó en 0,2 mm de euros y se situó en 324,3 mm de euros.
El saldo neto de las operaciones de mercado abierto y de las facilidades permanentes (diferencia entre la partida 5 del activo y la suma de las partidas 2.2, 2.3, 2.4, 2.5 y 4 del pasivo) aumentó en 218,7 mm de euros, hasta una cifra de -2.719,1 mm de euros, debido, fundamentalmente, a la variación del nivel de la facilidad de depósito (partida 2.2 del pasivo).
La base monetaria (partidas 1, 2.1 y 2.2 del pasivo) se redujo en 159,4 mm de euros, hasta situarse en 5.729,2 mm de euros.
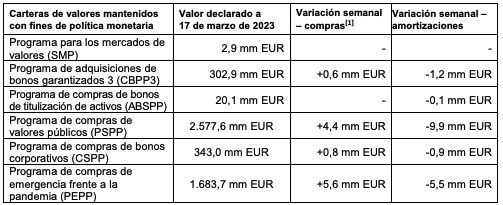
En el siguiente cuadro se muestra el desglose detallado por carteras de los valores mantenidos con fines de política monetaria (partida 7.1 del activo). Todas las carteras se contabilizan a coste amortizado.
El modelo y el contenido del estado financiero semanal se especifican en los anexos IV a VI de la Orientación (UE) 2016/2249 del Banco Central Europeo, de 3 de noviembre de 2016, sobre el régimen jurídico de la contabilidad y la información financiera en el Sistema Europeo de Bancos Centrales (BCE/2016/34).
Para más información accede al BCE
Si buscas una plataforma para operar acciones entra en nuestro comparador de brokers