Eurostat – Agricultural prices

Q4 2022: Agricultural prices increase at a lower rate

Eurostat has release today the latest information and stats about agricultural pricing in the last quarter of 2002, pricing still up but a lower rates. The Ukraine invansion from Russia has significantly damaged the global agricultural markets in 2022

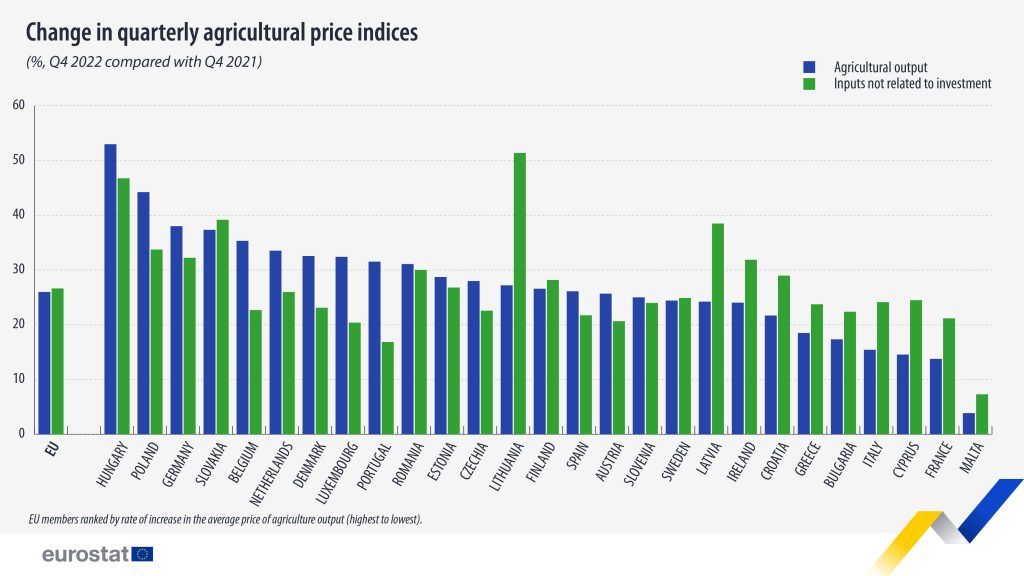
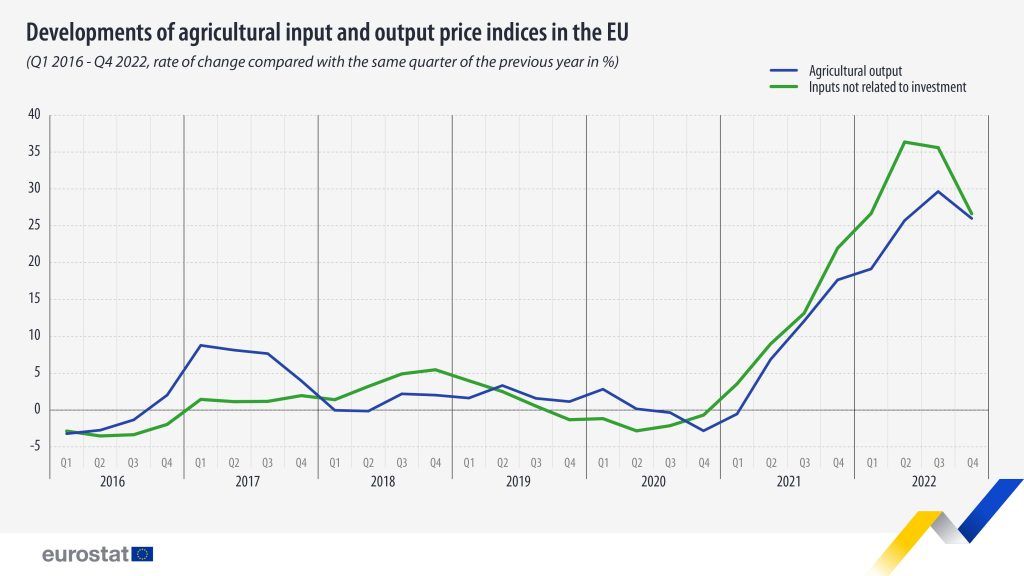
In the period before the war, Russia and Ukraine played a significant role in the global export of agricultural products such as grains, wheat, maize, oilseeds (specifically sunflowers), and fertilisers. According to Eurostat data, there was a noticeable rise in agricultural prices throughout 2022, with the most significant increases occurring in Q2 and Q3. Nevertheless, there was a small decrease in the rate of price increases for both agricultural products and inputs during Q4.

Russia and Ukraine were major players in the global export of agricultural products, including grains, wheat, maize, oilseeds (especially sunflowers), and fertilizers, until the war broke out. The data from Eurostat indicates a significant increase in the prices of agricultural commodities during all quarters of 2022, with the peak being in the second and third quarters (Q2 and Q3). However, in the fourth quarter, there was a slight deceleration in the rate of price hikes for both agricultural products and inputs.

Change in quarterly agricultural prices indices split by country

Eurostat on agricultural price indices 

Agricultural input and output price indices in the EU

This information comes from data on agricultural price indices published by Eurostat today.

All4brokers.com the blog about economic matters

EUROSTAT Índice de Producción en Construcción enero 2023

Eurostat ha lanzado hoy el Índice de Producción en Construcción de enero de 2023

En enero de 2023 comparado con diciembre de 2022 el Índice de Producción en Construcción ha aumentado un 3,9% en la Zona Euro y un 3,5% en la Unión Europea en su conjunto con datos estimados de la oficina de Estadística de Eurostat.

Con datos ya cerrados de Eurostat de enero 2023 comparado con enero 2022 la producción en construcción habría aumentado un 0,9% en la Zona Euro y un 1,4% en la Unión Europea en su conjunto.

EUROSTAT estimación Índice Producción Construcción enero 2023

Índice de Producción en Construcción

% change compared with the previous quarter / previous month*

 Q1-22Q2-22Q3-22Q4-22 Aug-22 Sep-22 Oct-22 Nov-22 Dec-22 Jan-23
Euro area          
  Total construction3.0-1.3-1.60.4-0.60.50.90.2-2.33.9
    Building2.9-1.0-1.70.3-0.30.40.70.1-1.94.2
    Civil engineering2.4-2.0-0.91.2-2.31.52.20.4-4.63.0
EU          
  Total construction2.9-1.2-1.50.7-0.50.41.00.3-2.03.5
    Building2.7-0.8-1.80.4-0.10.30.80.2-1.73.6
   Civil engineering2.8-2.1-0.61.8-2.21.91.61.0-2.92.3

 Source datasets: sts_copr_q (quarterly data) and sts_copr_m (monthly data).

Total constructionQ1-22Q2-22Q3-22Q4-22 Aug-22 Sep-22 Oct-22 Nov-22 Dec-22 Jan-23
Euro area 203.0-1.3-1.60.4-0.60.50.90.2-2.33.9
Euro area 192.9-1.2-1.60.4-0.60.51.00.1-2.33.9
EU2.9-1.2-1.50.7-0.50.41.00.3-2.03.5
Belgium2.7-0.60.2-0.3-1.3-1.10.11.6-0.7-1.5
Bulgaria0.4-0.2-0.80.30.3-0.20.70.3-1.70.8
Czechia4.2-2.5-3.62.21.5-1.72.80.0-0.15.1
Denmark1.51.9-0.10.70.40.7-0.10.10.5:
Germany3.0-3.2-1.9-1.6-1.40.22.4-1.8-7.512.6
Estonia**2.7-5.6-2.1-3.6::::::
Ireland**-3.6-3.0-1.8-3.1::::::
Greece**3.614.8-0.511.0::::::
Spain-2.6-2.3-1.5-2.2-0.4-2.0-0.1-0.80.03.0
France2.8-0.9-1.31.7-1.92.71.00.1-1.20.2
Croatia**1.51.00.82.80.80.50.61.41.9:
Italy5.90.4-3.12.22.60.1-0.82.80.41.4
Cyprus**-0.48.1-13.7c::::::
Latvia**0.6-5.8-3.10.0::::::
Lithuania**4.3-1.4-0.21.5::::::
Luxembourg**-1.22.63.2-3.51.63.4-8.73.51.8:
Hungary4.5-7.91.02.5-6.32.9-2.410.0-3.7-5.0
Malta**4.0-2.43.83.6::::::
Netherlands2.9-0.30.42.8-2.61.42.00.80.6-0.9
Austria5.00.2-2.50.51.1-0.80.71.8-3.32.9
Poland8.1-3.4-2.82.90.9-5.86.32.3-3.17.0
Portugal1.40.21.2-2.12.1-2.8-0.6-0.2-0.95.8
Romania9.10.44.87.42.03.95.3-1.7-0.3-4.3
Slovenia29.5-1.9-1.79.70.5-0.610.1-4.07.89.8
Slovakia-1.1-1.3-0.52.8-0.60.50.8-1.38.33.3
Finland0.9-0.4-1.2-1.20.0-0.2-1.0-0.71.1-0.5
Sweden-1.80.2-0.21.5-0.22.3-0.5-0.21.71.2
Norway1.30.7-0.80.83.10.2-0.3-0.30.4-0.4
Switzerland-0.4-0.5-5.51.1::::::

*    Calendar and seasonally adjusted         

**  These Member States are not required to supply monthly data under Regulation (EU) 2019/2152

:    Data not available         

c  Confidential

Source datasets: sts_copr_q (quarterly data) and sts_copr_m (monthly data)

Índice de Producción en Construcción

% cambio comparado con el trimestre y mes previo*

 Q1-22Q2-22Q3-22Q4-22 Aug-22 Sep-22 Oct-22 Nov-22 Dec-22 Jan-23
Euro area          
  Total construction6.12.70.90.51.60.30.71.4-0.60.9
    Building5.93.11.00.41.80.40.71.2-0.51.4
    Civil engineering7.10.70.31.0-0.2-0.71.21.9-2.0-1.9
EU          
  Total construction6.42.91.30.82.10.71.31.8-0.11.4
    Building6.33.41.30.42.50.71.01.4-0.61.5
    Civil engineering7.31.20.81.9-0.20.61.63.00.20.5

Source datasets: sts_copr_q (quarterly data) and sts_copr_m (monthly data)

Total constructionQ1-22Q2-22Q3-22Q4-22 Aug-22 Sep-22 Oct-22 Nov-22 Dec-22 Jan-23
Euro area 206.12.70.90.51.60.30.71.4-0.60.9
Euro area 196.12.70.90.41.60.20.71.3-0.60.9
EU6.42.91.30.82.10.71.31.8-0.11.4
Belgium-1.92.11.64.54.0-1.6-1.413.23.1-4.7
Bulgaria3.11.1-0.8-0.10.0-1.41.71.3-4.0-0.3
Czechia11.34.0-0.8-0.20.8-2.62.2-0.2-2.75.4
Denmark6.46.45.23.86.54.83.93.53.9:
Germany4.2-2.7-2.5-3.7-1.9-3.0-0.9-2.3-8.0-1.6
Estonia**13.9-1.5-3.3-8.8::::::
Ireland**22.36.7-1.7-10.9::::::
Greece**14.125.720.731.3::::::
Spain-5.9-8.8-6.9-7.0-4.0-10.8-8.3-6.9-6.31.9
France2.83.01.82.23.91.20.31.95.4-0.9
Croatia**4.74.33.96.04.13.84.25.78.6:
Italy22.516.87.55.08.87.54.35.84.85.9
Cyprus**-6.6-6.2-5.0c::::::
Latvia**-8.4-13.8-13.6-8.4::::::
Lithuania**9.64.42.63.3::::::
Luxembourg**2.7-2.1-0.60.7-0.81.1-3.7-0.38.3:
Hungary17.6-0.31.10.1-0.71.4-3.27.6-3.9-3.6
Malta**8.43.55.49.2::::::
Netherlands5.53.44.56.31.73.86.65.76.53.8
Austria4.74.12.32.93.71.53.44.80.32.1
Poland22.79.24.03.76.10.23.94.03.40.2
Portugal3.61.61.61.52.00.71.71.31.56.3
Romania6.32.216.823.214.425.933.819.718.45.9
Slovenia20.017.714.835.716.510.938.726.245.726.7
Slovakia1.3-1.7-0.3-0.4-2.00.4-0.4-5.84.914.7
Finland8.33.21.4-2.61.80.4-2.3-5.2-0.3-2.7
Sweden1.10.80.4-0.52.11.80.1-0.1-1.45.5
Norway4.76.34.22.15.34.82.52.21.50.4
Switzerland-1.7-1.2-8.0-5.5::::::

*  Calendar adjusted

** These Member States are not required to supply monthly data under Regulation (EU) 2019/2152

:   Data not available              

c  Confidential

Source datasets: sts_copr_q (quarterly data) and sts_copr_m (monthly data)

Monthly indices for production in construction, calendar and seasonally adjusted

(base year 2015)

 01-2202-2203-2204-2205-2206-2207-2208-2209-2210-2211-2212-2201-23
Euro area 20113.5115.0115.1113.5113.5112.4111.6110.9111.5112.5112.7110.1114.4
Euro area 19113.4114.9115.0113.3113.4112.3111.4110.7111.3112.4112.5109.9114.2
EU115.7116.9117.2115.4115.7114.4113.8113.2113.7114.8115.2112.9116.9
Belgium98.3100.499.798.899.498.6100.399.097.998.099.698.997.4
Bulgaria91.190.990.589.991.890.489.990.290.090.690.989.490.1
Czechia110.0115.4114.5112.3109.7109.3106.0107.6105.8108.8108.8108.7114.2
Denmark131.2131.6131.2135.2133.9132.1132.9133.4134.4134.3134.4135.1:
Germany117.1117.4116.4112.7113.9113.1112.0110.4110.6113.3111.3102.9115.9
Spain81.381.680.880.579.078.578.878.576.976.876.276.278.5
France104.9105.2104.4104.5104.2102.9102.9100.9103.6104.6104.7103.4103.6
Croatia*138.4140.0139.9140.6140.7141.1140.9142.0142.7143.6145.6148.4:
Italy132.3137.6142.3139.6138.3135.8131.3134.7134.9133.8137.5138.1140.1
Luxembourg*106.7106.6101.2103.8111.0108.1108.6110.3114.0104.1107.7109.6:
Hungary159.0177.8171.4151.7163.9152.4163.0152.7157.2153.5168.8162.5154.4
Netherlands133.3136.2136.0134.0134.6135.7137.2133.6135.5138.2139.3140.1138.8
Austria130.6132.2134.5134.1133.6130.5128.8130.2129.1130.0132.3128.0131.7
Poland136.5129.3135.3128.5131.4127.4127.2128.4120.9128.5131.5127.4136.3
Portugal103.5106.3107.0106.1106.1105.2106.7108.9105.8105.2105.0104.1110.1
Romania138.4139.4137.2134.0141.5141.3141.8144.7150.4158.3155.6155.2148.5
Slovenia152.7167.3158.2150.7157.6160.6153.4154.2153.3168.8162.1174.7191.9
Slovakia80.684.387.083.583.981.482.782.282.683.382.289.091.9
Finland121.6122.2121.9122.1121.4120.8120.1120.1119.9118.7117.9119.2118.6
Sweden123.3122.6124.1122.4124.9123.1122.5122.2125.0124.4124.2126.3127.8
Norway123.2123.3123.2123.4124.4124.3120.5124.2124.4124.0123.6124.1123.6

*      These Member States are not required to supply monthly data under Regulation (EU) 2019/2152

:      Data not available         Source dataset: sts_copr_m

Quarterly indices for production in construction, calendar and seasonally adjusted

(base year 2015)

 Q1-21Q2-21Q3-21Q4-21Q1-22Q2-22Q3-22Q4-22
Euro area 20108.9110.6110.2111.7115.0113.5111.7112.2
Euro area 19108.8110.5110.1111.6114.8113.4111.6112.0
EU110.4112.4111.9113.6116.9115.5113.8114.6
Belgium99.898.297.896.999.598.999.198.8
Bulgaria88.589.790.090.590.990.790.090.3
Czechia103.4106.5106.5108.7113.3110.5106.5108.8
Denmark123.6126.2126.8129.3131.3133.8133.6134.6
Germany113.1116.5113.8113.6117.0113.2111.0109.2
Estonia145.9157.0156.9160.1164.4155.2151.9146.5
Ireland110.0123.1131.8140.6135.5131.5129.1125.1
Greece63.266.368.469.972.483.182.791.8
Spain87.185.983.683.481.279.378.176.4
France102.3100.8100.4101.9104.8103.9102.5104.2
Croatia133.8135.1136.1137.3139.4140.8141.9145.9
Italy113.1118.4123.6129.8137.4137.9133.6136.5
Cyprus201.4217.3185.5189.5188.8204.1176.2c
Latvia125.7125.3120.8114.0114.7108.0104.6104.6
Lithuania122.8125.7127.1126.8132.2130.3130.1132.0
Luxembourg104.0109.5110.6106.2104.9107.6111.0107.1
Hungary145.7155.0155.3162.1169.4156.0157.6161.6
Malta152.4155.7158.8158.9165.2161.2167.4173.5
Netherlands128.4129.7128.0131.4135.2134.8135.4139.2
Austria127.1127.8125.8126.1132.4132.7129.4130.1
Poland110.5118.7120.6123.7133.7129.1125.5129.1
Portugal101.2104.3105.1104.1105.6105.8107.1104.8
Romania133.3138.8124.1126.8138.3138.9145.6156.4
Slovenia133.5133.0133.0123.1159.4156.3153.6168.5
Slovakia83.784.582.384.984.082.982.584.8
Finland113.5117.6118.4120.8121.9121.4120.0118.6
Sweden122.3122.8122.6125.5123.3123.5123.2125.0
Norway117.7116.7118.2121.5123.1124.0123.0124.0
Switzerland102.0101.2102.1100.6100.299.794.295.2

c    Confidential          Source dataset: sts_copr_q

Índice de Producción en Construcción por meses

(base year 2015)

 01-2101-2202-2203-2204-2205-2206-2207-2208-2209-2210-2211-2212-2201-23
Euro area 2092.095.8106.8120.0113.9116.6119.3116.690.4118.6122.9122.9108.296.7
Euro area 1991.895.6106.6119.9113.7116.5119.2116.490.2118.4122.8122.8108.196.5
EU90.995.1105.9120.2114.7118.5121.7116.495.3121.2126.0126.8115.596.4
Belgium105.293.0104.1114.299.6104.4113.163.398.6112.7114.3100.980.388.6
Bulgaria84.787.687.193.987.787.696.294.993.087.095.993.979.787.3
Czechia57.159.872.096.4106.9114.7119.1111.3120.0120.1128.2134.8108.463.0
Denmark118.7127.3128.6134.7131.6134.9135.1119.4130.2143.2144.8143.2126.4:
Germany75.382.497.1116.7112.3113.9118.6120.5110.6118.2122.7124.5113.481.1
Spain81.475.474.179.874.674.974.984.268.877.375.582.5103.376.8
France101.0100.5107.2109.2106.5107.4112.4109.566.4108.0115.3113.489.999.6
Croatia*125.8131.3139.9153.8147.0146.0143.4145.0129.4145.4147.8141.4132.0:
Italy97.3114.5134.5157.9142.1152.3144.5148.987.7141.2146.8145.1126.6121.3
Luxembourg*93.498.7110.6122.2112.7109.8111.9112.664.2122.0116.1116.992.3:
Hungary88.389.2119.5164.7123.9158.4165.7166.0153.4189.5165.5209.4219.186.0
Netherlands134.5136.3144.2154.9146.9140.8145.6128.178.6150.4154.0149.896.6141.5
Austria74.579.397.1129.1127.1134.4138.8139.3127.7142.9147.2160.2151.581.0
Poland68.581.084.4116.7113.5126.5134.0129.2131.0135.3145.9155.3180.981.2
Portugal99.5101.6107.6108.1105.5108.8107.3107.898.7105.8108.5109.3101.1108.0
Romania64.670.889.2118.0121.0140.2151.3144.6152.1162.5181.5189.2221.575.0
Slovenia93.6107.8130.1148.8140.1158.1168.4157.4156.6170.7202.3202.9158.1136.6
Slovakia52.049.658.275.774.282.085.285.388.694.997.799.7107.956.9
Finland80.987.397.0109.3110.3124.0131.9117.2127.9131.9133.3127.1140.784.9
Sweden89.193.8107.1121.3122.9129.8136.495.1110.1129.8139.2141.0158.099.0
Norway123.6129.1115.7125.5113.7118.4132.379.2124.1142.9140.8142.3119.5129.6

*      These Member States are not required to supply monthly data under Regulation (EU) 2019/2152

:      Data not available          Source dataset: sts_copr_m

Quarterly indices for production in construction, calendar adjusted

(base year 2015)

 Q1-21Q2-21Q3-21Q4-21Q1-22Q2-22Q3-22Q4-22
Euro area 20101.1113.7108.3118.2107.3116.8109.3118.8
Euro area 19101.0113.6108.2118.2107.2116.7109.2118.7
EU100.5115.1110.2122.2106.9118.4111.6123.2
Belgium105.8103.590.194.3103.8105.791.598.5
Bulgaria86.989.592.390.089.690.591.689.9
Czechia68.3109.2118.1124.076.0113.6117.1123.8
Denmark122.4125.8124.4133.1130.2133.9130.9138.1
Germany94.7118.1119.4124.898.7114.9116.4120.2
Estonia110.8163.6177.0168.8126.2161.2171.2154.0
Ireland95.4121.8140.3152.3116.7130.0137.9135.7
Greece48.163.466.393.154.979.780.0122.2
Spain81.282.082.593.776.474.876.887.1
France102.7105.692.9103.9105.6108.894.6106.2
Croatia135.4139.5134.6132.4141.7145.5139.9140.4
Italy110.7125.3117.1132.9135.6146.3125.9139.5
Cyprus187.7201.6187.5213.5175.4189.2178.2c
Latvia77.4117.5148.6134.970.9101.3128.4123.6
Lithuania85.1127.4143.9145.993.3133.0147.7150.7
Luxembourg107.6113.9100.2107.6110.5111.599.6108.4
Hungary105.9149.7167.7197.9124.5149.3169.6198.0
Malta152.4155.7158.8158.9165.2161.2167.4173.5
Netherlands137.5139.7113.9125.6145.1144.4119.0133.5
Austria97.2128.2133.5148.7101.8133.4136.6153.0
Poland76.6114.2126.7154.994.0124.7131.8160.7
Portugal102.1105.5102.5104.7105.8107.2104.1106.3
Romania87.2134.5131.1160.292.7137.5153.1197.4
Slovenia107.4132.1140.8138.4128.9155.5161.6187.8
Slovakia60.481.989.9102.261.280.589.6101.8
Finland90.4118.3124.0137.297.9122.1125.7133.7
Sweden106.2128.7111.2146.8107.4129.7111.7146.1
Norway117.9114.3110.7131.4123.4121.5115.4134.2
Switzerland80.9104.7106.3114.579.5103.497.8108.2

c   Confidential     Source dataset: sts_copr_q

Si buscas una plataforma con el cual realiza tus operaciones de compra y venta de acciones entra en nuestro recomendador de brokers

Salir de la versión móvil